2.3 Lab Exercises
Overview
In this lab, we will learn how to use raw Illumina sequencing reads to genome complexity: genome size, heterozygosity size, and ploidy.
We will do three major things in this lab:
Learn what kmers are
Generate kmer frequencies with Jellyfish
Run Jellyfish on our dataset
“If everything was perfect, you would never learn and you would never grow.” -Beyoncé
Task A:
Step 1: What is a k-mer?
Today we’ll explore the power of k-mers and their application to genome sequencing.
K-mers are all possible substrings length k of a sequence string. A sequence string can refer to an Illumina read, a PacBio read, a gene assembly, a genome assembly, or any other string of nucleotides. We can search for kmers of any length k.
For a given sequence string length L, there are L – K + 1 possible k-mers in that string. In the example below, we have a sequence of length (L) = 7: ACTGGCT. To find all possible k-mers of length 3 (3-mers) in that string:
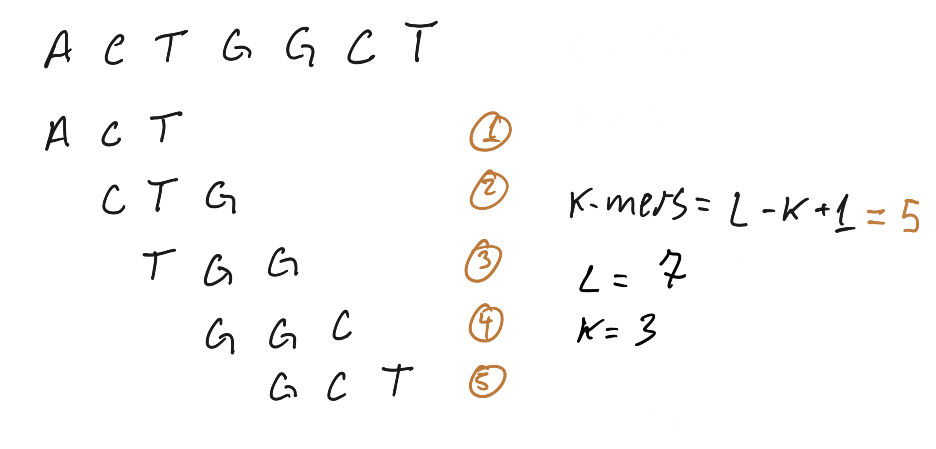
Image Source: K-mer analysis with python
In this example, all possible k-mers were unique and appeared only once. When k-mers appear more than once, we can count their frequency, e.g. 3-mer “ACT” appears 33 times in the string.
Step 2: Calculate all possible 21-mers in our dataset
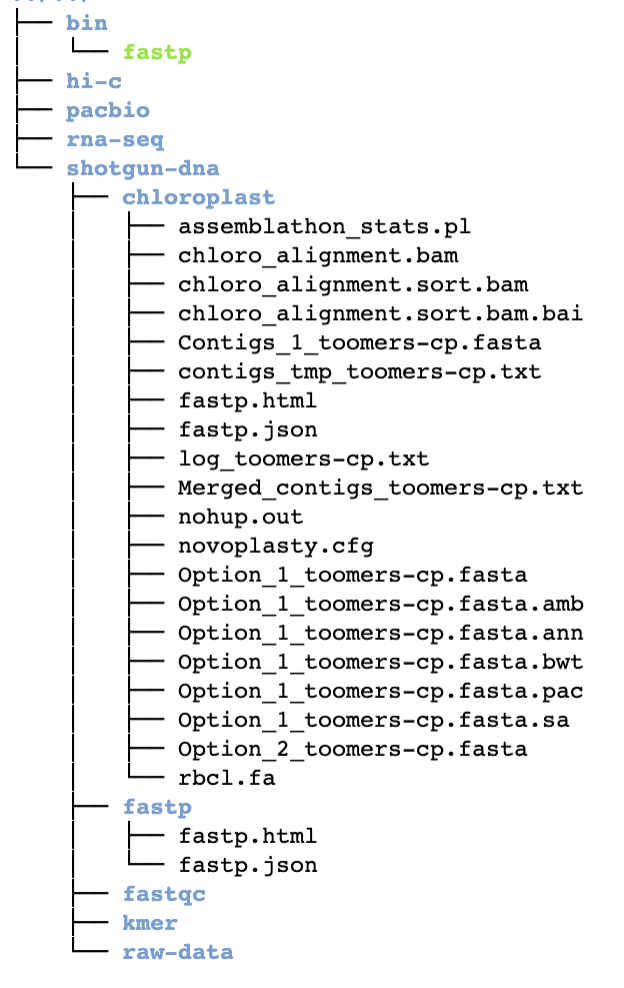
First, make a new directory in shotgun-data/ called kmer/. My tree directory looks like this now:
Next, install Jellyfish using Conda.
I left a reduced dataset of just 10,000 lines of your Toomer’s Oak data in /scratch/ for
us to play around with:
/scratch/test-kmer.fastq
Check out the help page for jellyfish count using
jellyfish count -help
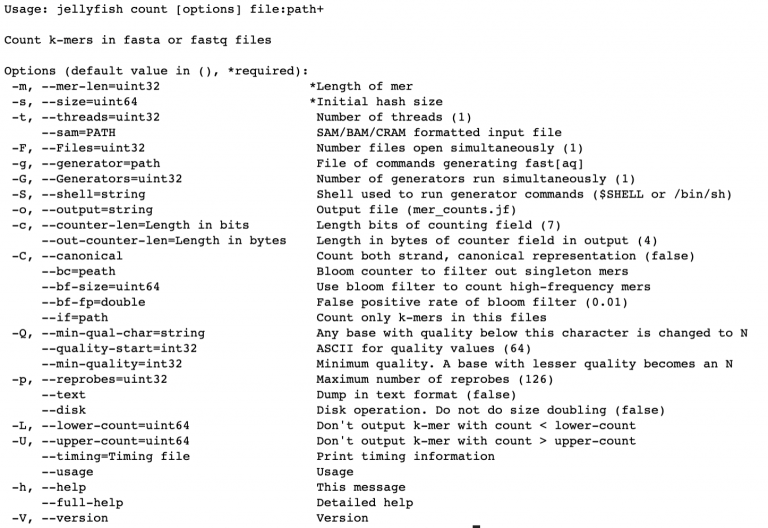
There are just a couple options we need to invoke, -m (what kmer size do we want,
-s (how much memory do we want to use to store the kmers), and take note that we
can also multi-thread it with -t. We use -C to count k-mers on both strands of
DNA (top and bottom).
Here’s how to run jellyfish to count all possible 4-mers in the test data:
jellyfish count -C -m 4 -s 10000000 /scratch/test-kmer.fastq > test.jf
The output is a compressed file called “mer_counts.jf” that is not human-readable. But we can query this file in many ways. For example
# Get some stats on the k-mers, including how many occur only once, how many
# distinct k-mers exist, and how many total k-mers exist.
jellyfish stats mer_counts.jf

# dump a fasta-like file with all the kmer's and their counts
jellyfish dump mer_counts.jf

# Count the frequency of a specific 4-mer, e.g. ATTG
jellyfish query mer_counts.jf ATTG
On your own: Generate a kmer count of this test dataset for k=7 and count the number of k-mers ATTCGAG.
Task B
- Next, we will use Jellyfish and GenomeScope to build a
kmer spectra.
A K-mer spectra is a graphical representation of a dataset showing how many short fixed length words (k-mers) appear a certain number of times. The frequency of occurrence is plotted on the x-axis and the number of k-mers on the y-axis. The k-mer spectra is composed of distributions representing groups of motifs at different frequencies in the sample, plus biases. Given not too many biases, the shape of the distributions provides a useful set of properties describing the biological sample, the sequencing process and the amount of useful data in the dataset.
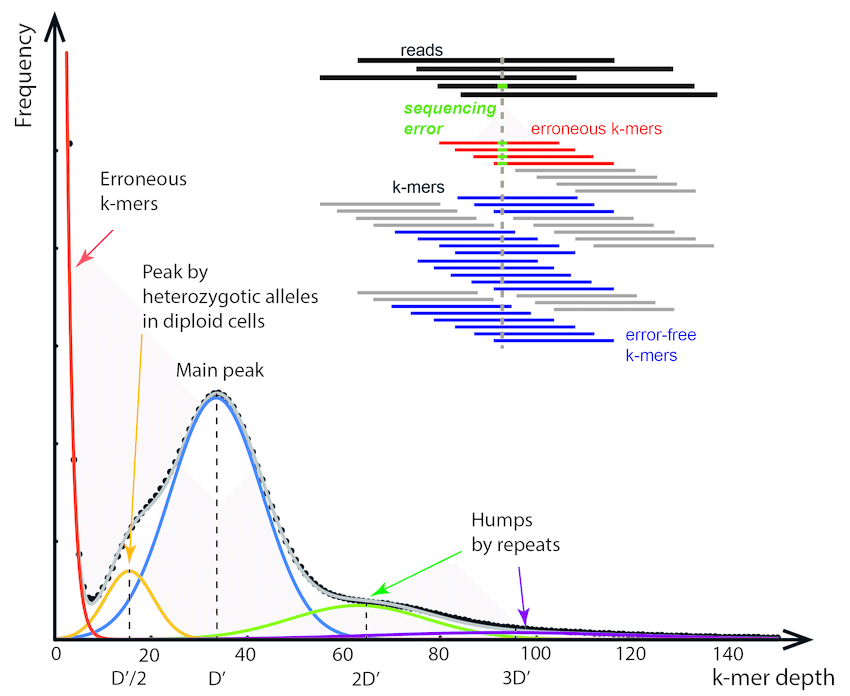
K-mer histogram. The x-axis refers to the k-mer depth D(k), which… Image Source: Jang-il Sohn, Jin-Wu Nam, The present and future of de novo whole-genome assembly, Briefings in Bioinformatics, Volume 19, Issue 1, January 2018, Pages 23–40, https://doi.org/10.1093/bib/bbw096
Sequencing errors occur randomly in Illumina sequencing. These will be represented in a kmer spectra as a high frequency (high on y-axis) of k-mers that occur just a few times (low on X-axis).
Let’s review what heterozygosity looks like. In this example we have a diploid organism with two homologous chromosomes (A and B) for chromosome 1. If we have two sequencing reads that hit both A and B alleles, and we break up those reads into k-mers (the dark blue blocks), it looks like this:
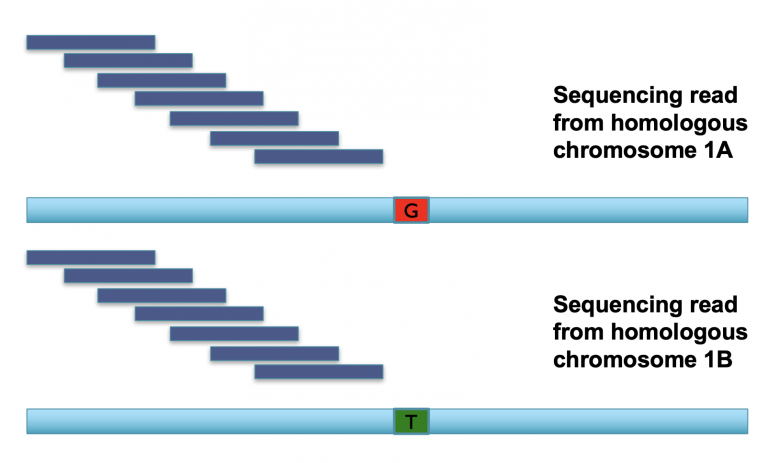
The k-mers that span most of these two reads are identical, meaning we have two copies of every k-mer across most of the read, representing the shared parts of both alleles (aka the “haploid” representation of the genome). Once we find k-mers that span the mutation, however, we have k-mers that are unique to each allele (the “diploid” representation of the genome). Consequently, these diploid k-mers are present at 1/2 coverage relative to the rest of the k-mers in the read.
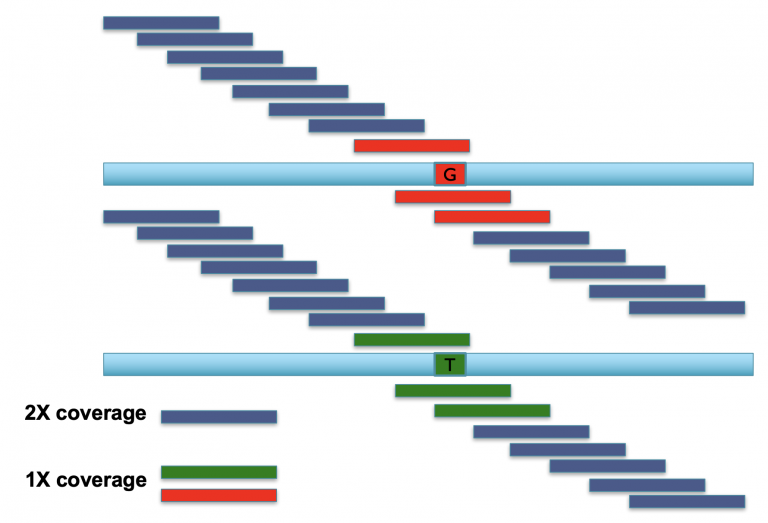
Image Source: Mike Schatz
When you do this repeatedly across a diploid genome with shotgun Illumina reads, these kmer coverages can be used to calculate the heterozygosity of an organism. The heterozygous k-mers (a) are at 50% depth (the peak on the left) compared to the homozygous k-mers (the peak on the right). Comparing the relative heights of the diploid/heterozygous peak on the left, to the homozygous/haploid peak on the right, allows you to calculate heterozygosity. Increasing heterozygosity means that the left peak gets higher. X axis is coverage/depth of kmers, and the Y axis is the number of unique kmers at that given coverage/depth.
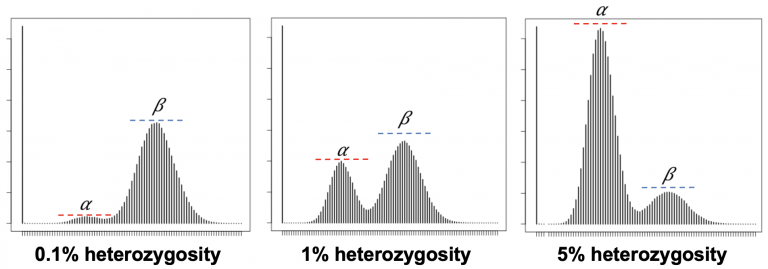
These data also tell us genome size, but we’ll discuss that next lab.
Run Jellyfish as GenomeScope describes
GenomeScope can calculate heterozygosity for us, using shotgun sequencing reads. It tells us exactly how it wants to be run:
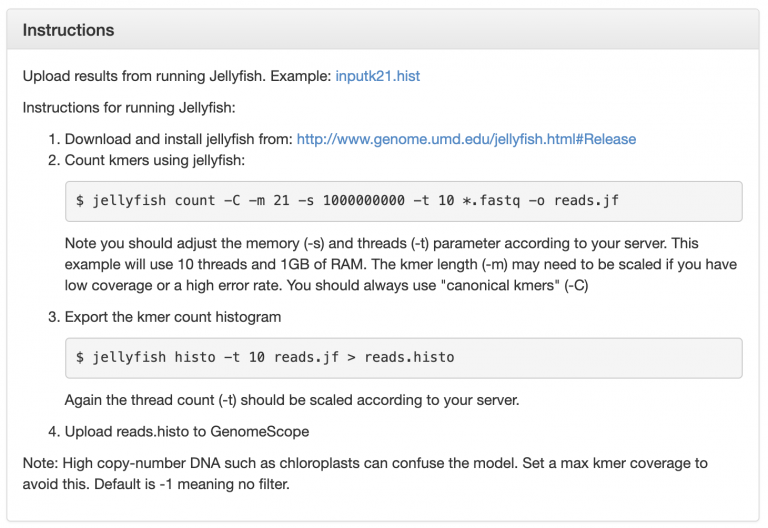
Now, run Jellyfish count on the raw Toomer’s Illumina data, except remember that we only have access to 4 threads, so change -t to 4:
jellyfish count -t 4 -C -m 21 -s 500000000 /scratch/*.fastq.gz -o reads.jf
Mastering Content
If you run Jellyfish like this, you’ll get an error like this one:

Jellyfish can’t open a .fastq.gz file? Interesting. On your own and with your classmates,
try and troubleshoot this issue.
Hint: I wonder if the help page has some clues for us.